Focused on helping business to take control on their desicions. My motto is "Your business in your hands". I ask the right questions to uncover the most impactful insights. I build end-to-end data projects: from extracting and cleaning real-world data to analysis, visualization, and automation.
How Can Menu Engineering, Peak-Hour Demand, and Cross-Selling Boost a Coffee Shop’s Profitability?
Coffee Shop Sales Analysis & Interactive Power BI Dashboard
PythonpandasMatplotlibSeabornPower BI
A comprehensive data analysis of sales performance and customer behavior focused on optimizing the business strategy and profitability of a coffee shop using Python and Power BI.
Data Pipeline Transformation Slicer
Select pipeline state to interactively inspect how chaotic raw ingestion filled with anomalies transforms into a pristine model.
Pipeline StatusRaw Ingestion
Anomalies Detected10 Critical Errors
Data Integrity42.8%
🚨 [State: Raw Dataset] - Extreme corruption: NaN values, negative prices, duplicate IDs, typos and format breaks.
tx_id
timestamp
item
price
payment
store_loc
customer_id
TX1001
2026-01-01 08:30
Latte
3.50
Credit
Downtown
C-4091
TX1002
MISSING_DATE
Espresso
ERROR_NaN
Debit
Downtown
C-8812
TX1003
01/01/2026 09:15
Croissant
-99.99
Cash
Airport
C-1029
TX1004
2026.01.01
M#cha
4.00
Credit
Downtown
C-3304
TX1001
2026-01-01 10:20
Muffin
FREE_PROMO
Cash
Airport
C-5012
TX1006
2026-01-01 11:05
Cappuccino
3.75
???_UNKNOWN
Downtown
C-9921
TX1007
2026-01-01 11:40
Tea
2.00
Credit
ERROR_404
NULL_USER
TX1008
BAD_DATE_FORMAT
Americano
2.80
Debit
Downtown
C-2290
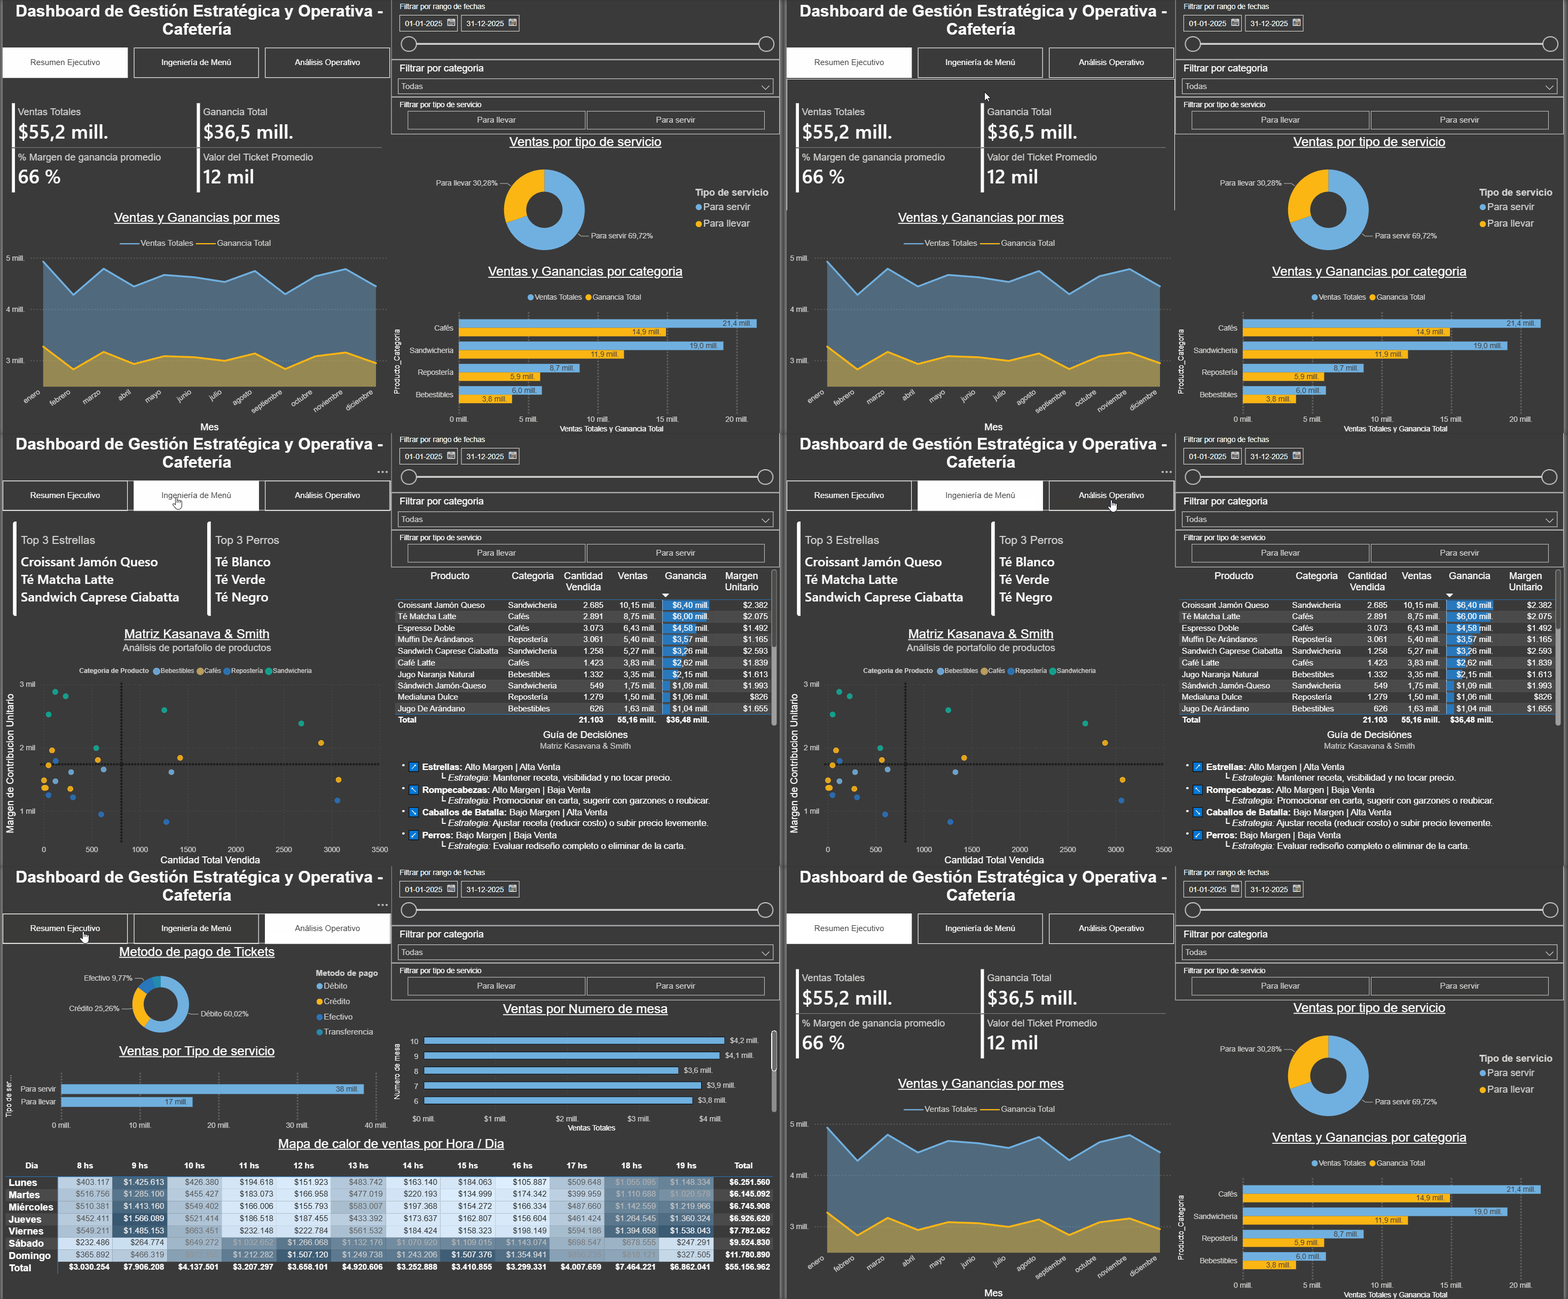
Final Interactive Dashboard (Power BI)
Consolidated business intelligence view designed for executive decision-making and operational control.
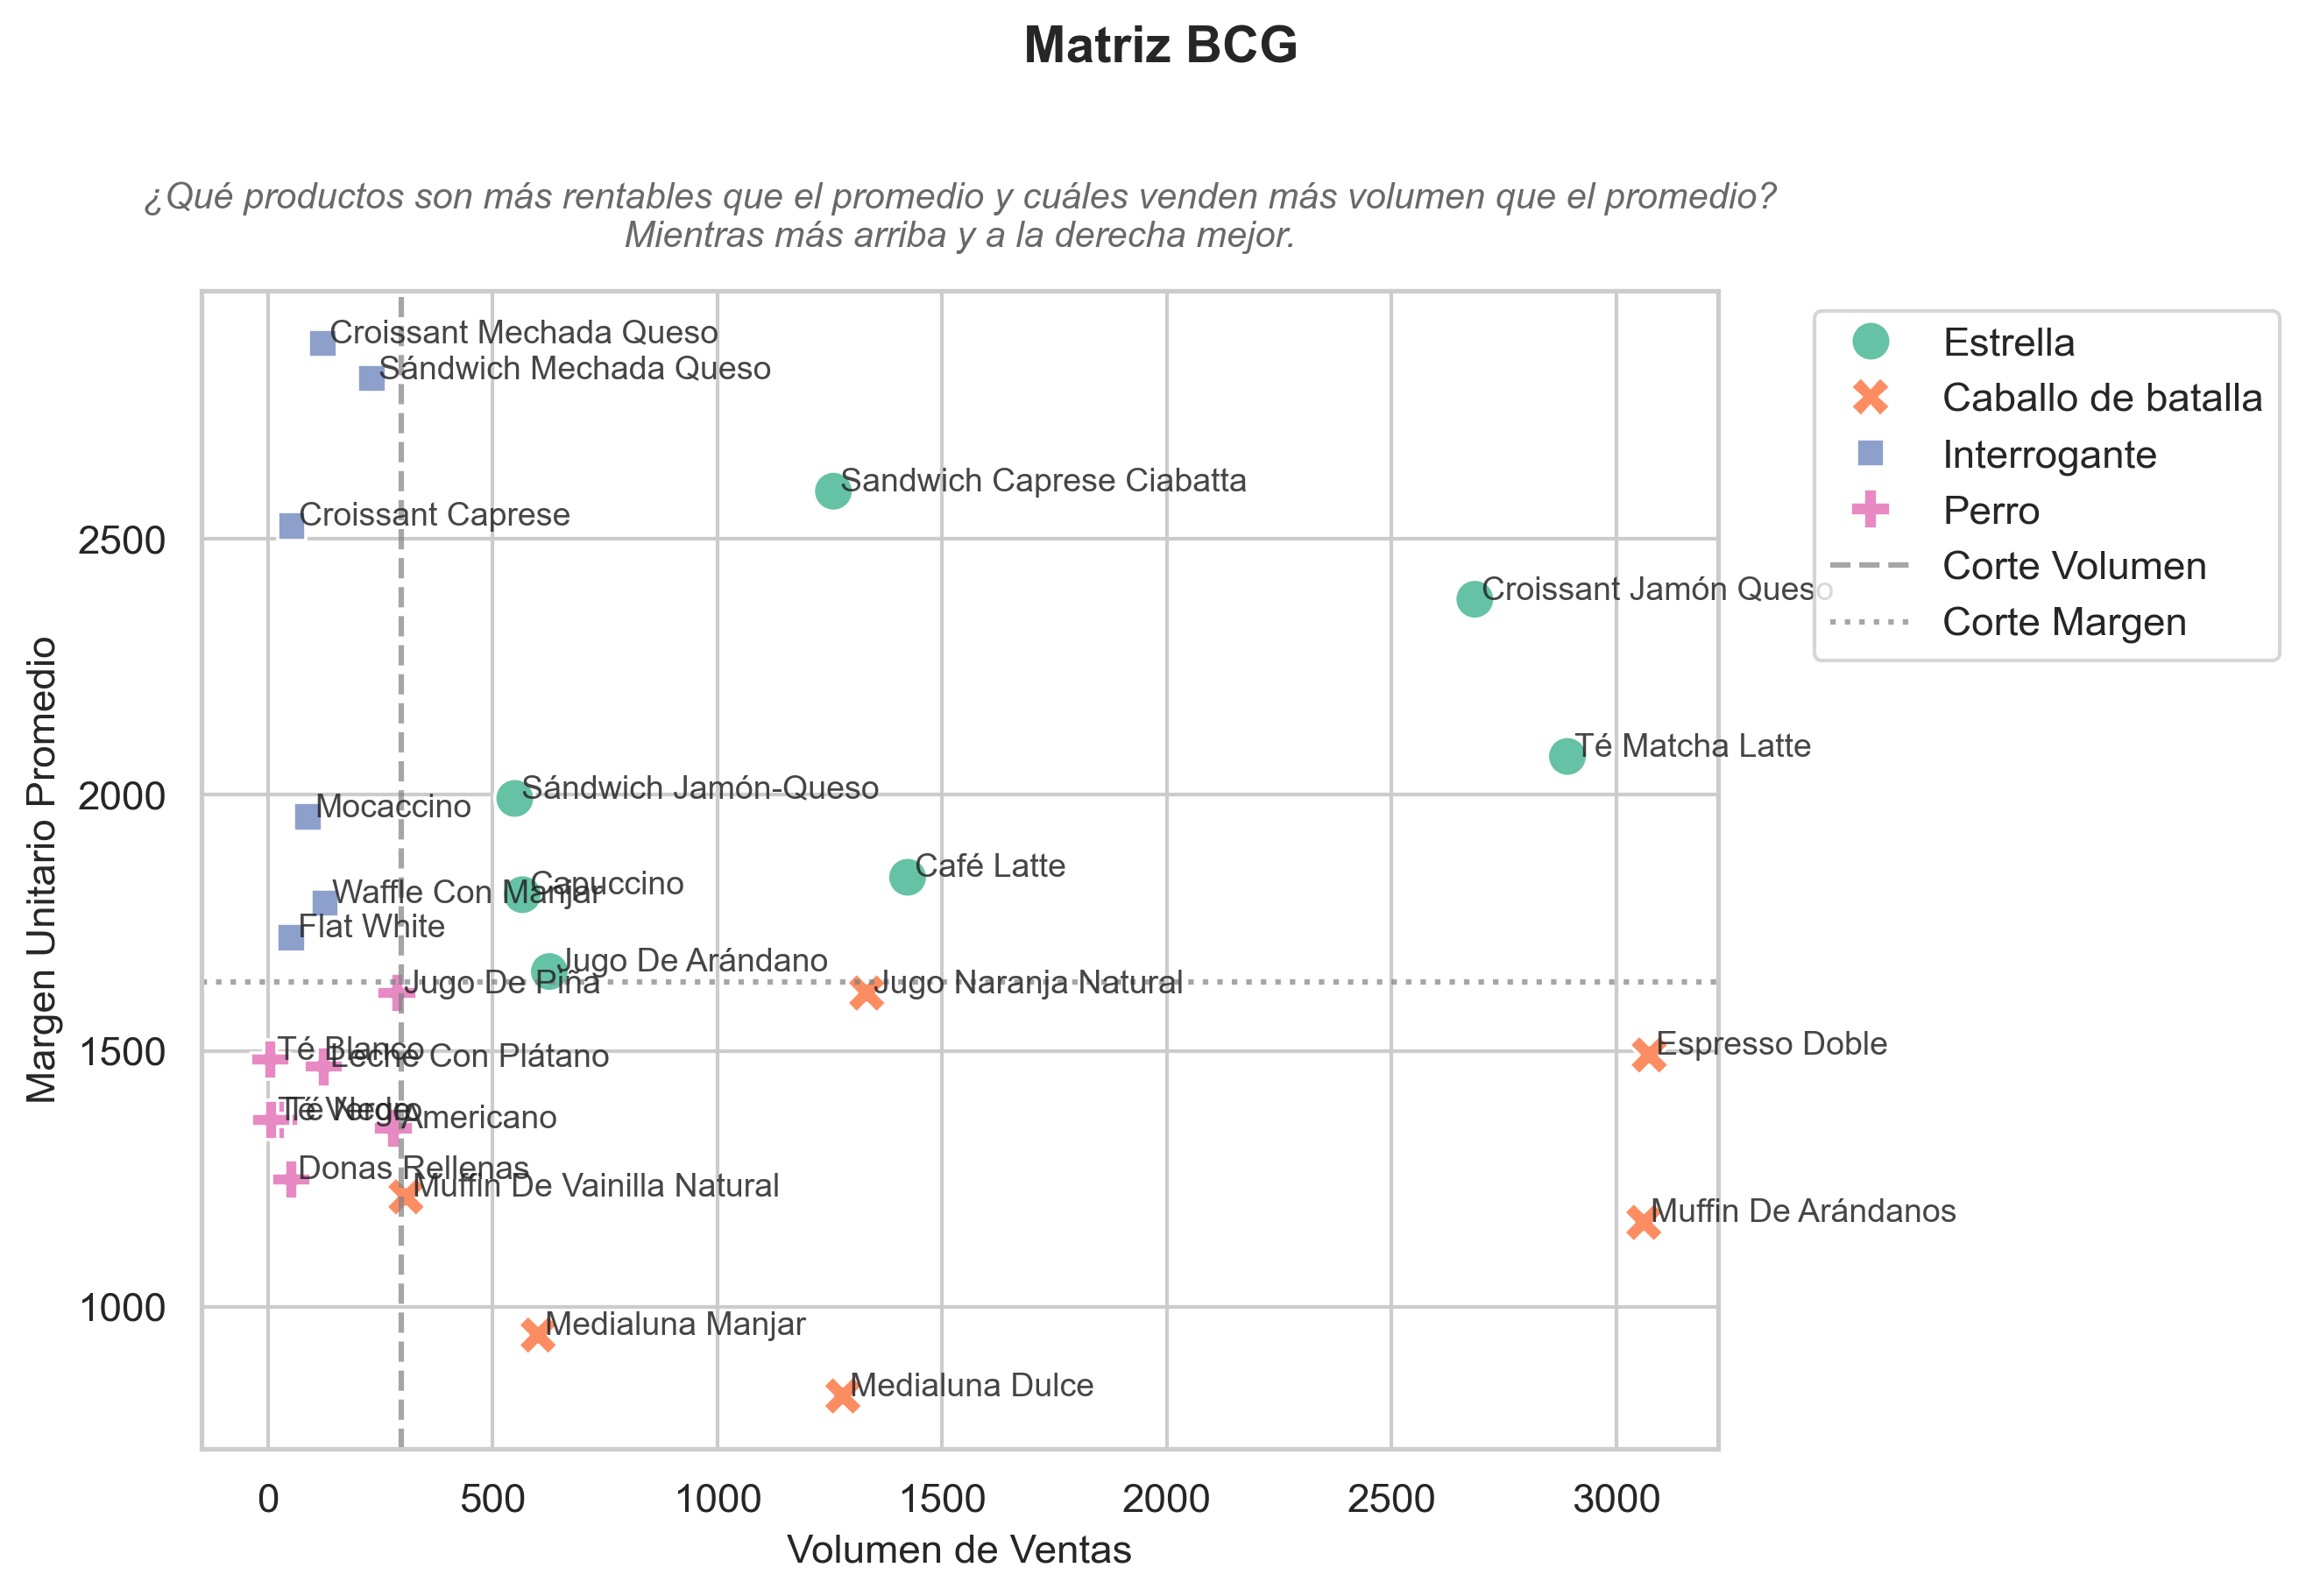
Products categorized by profitability and sales volume.
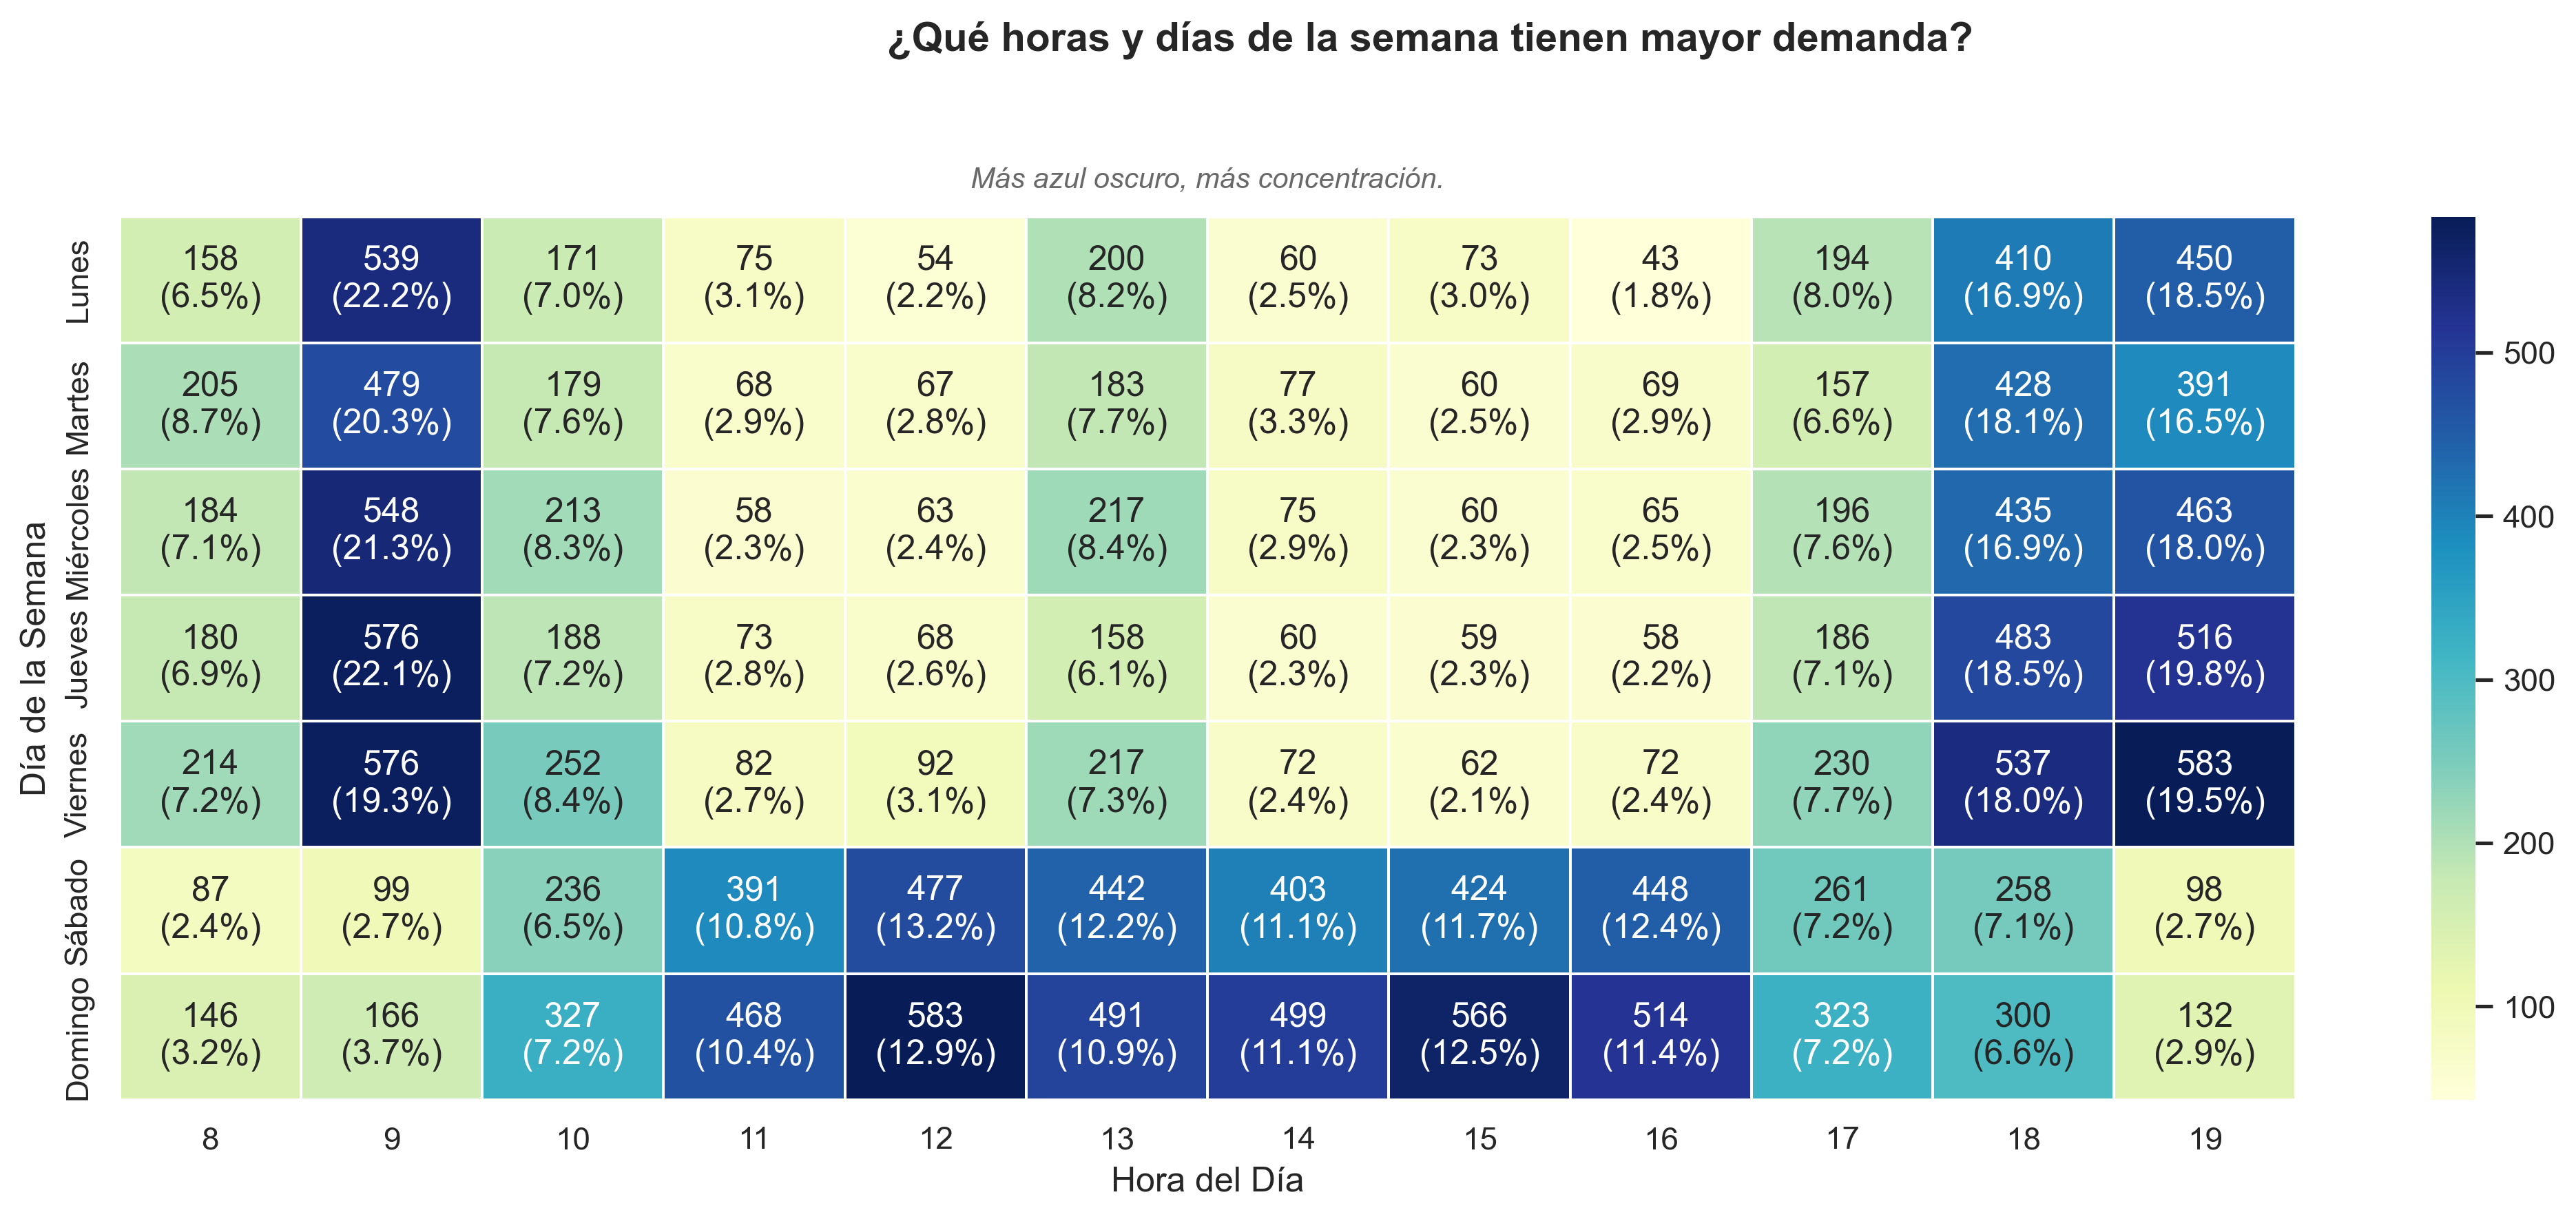
Time-of-Day Demand
Identification of bimodal operational peaks.
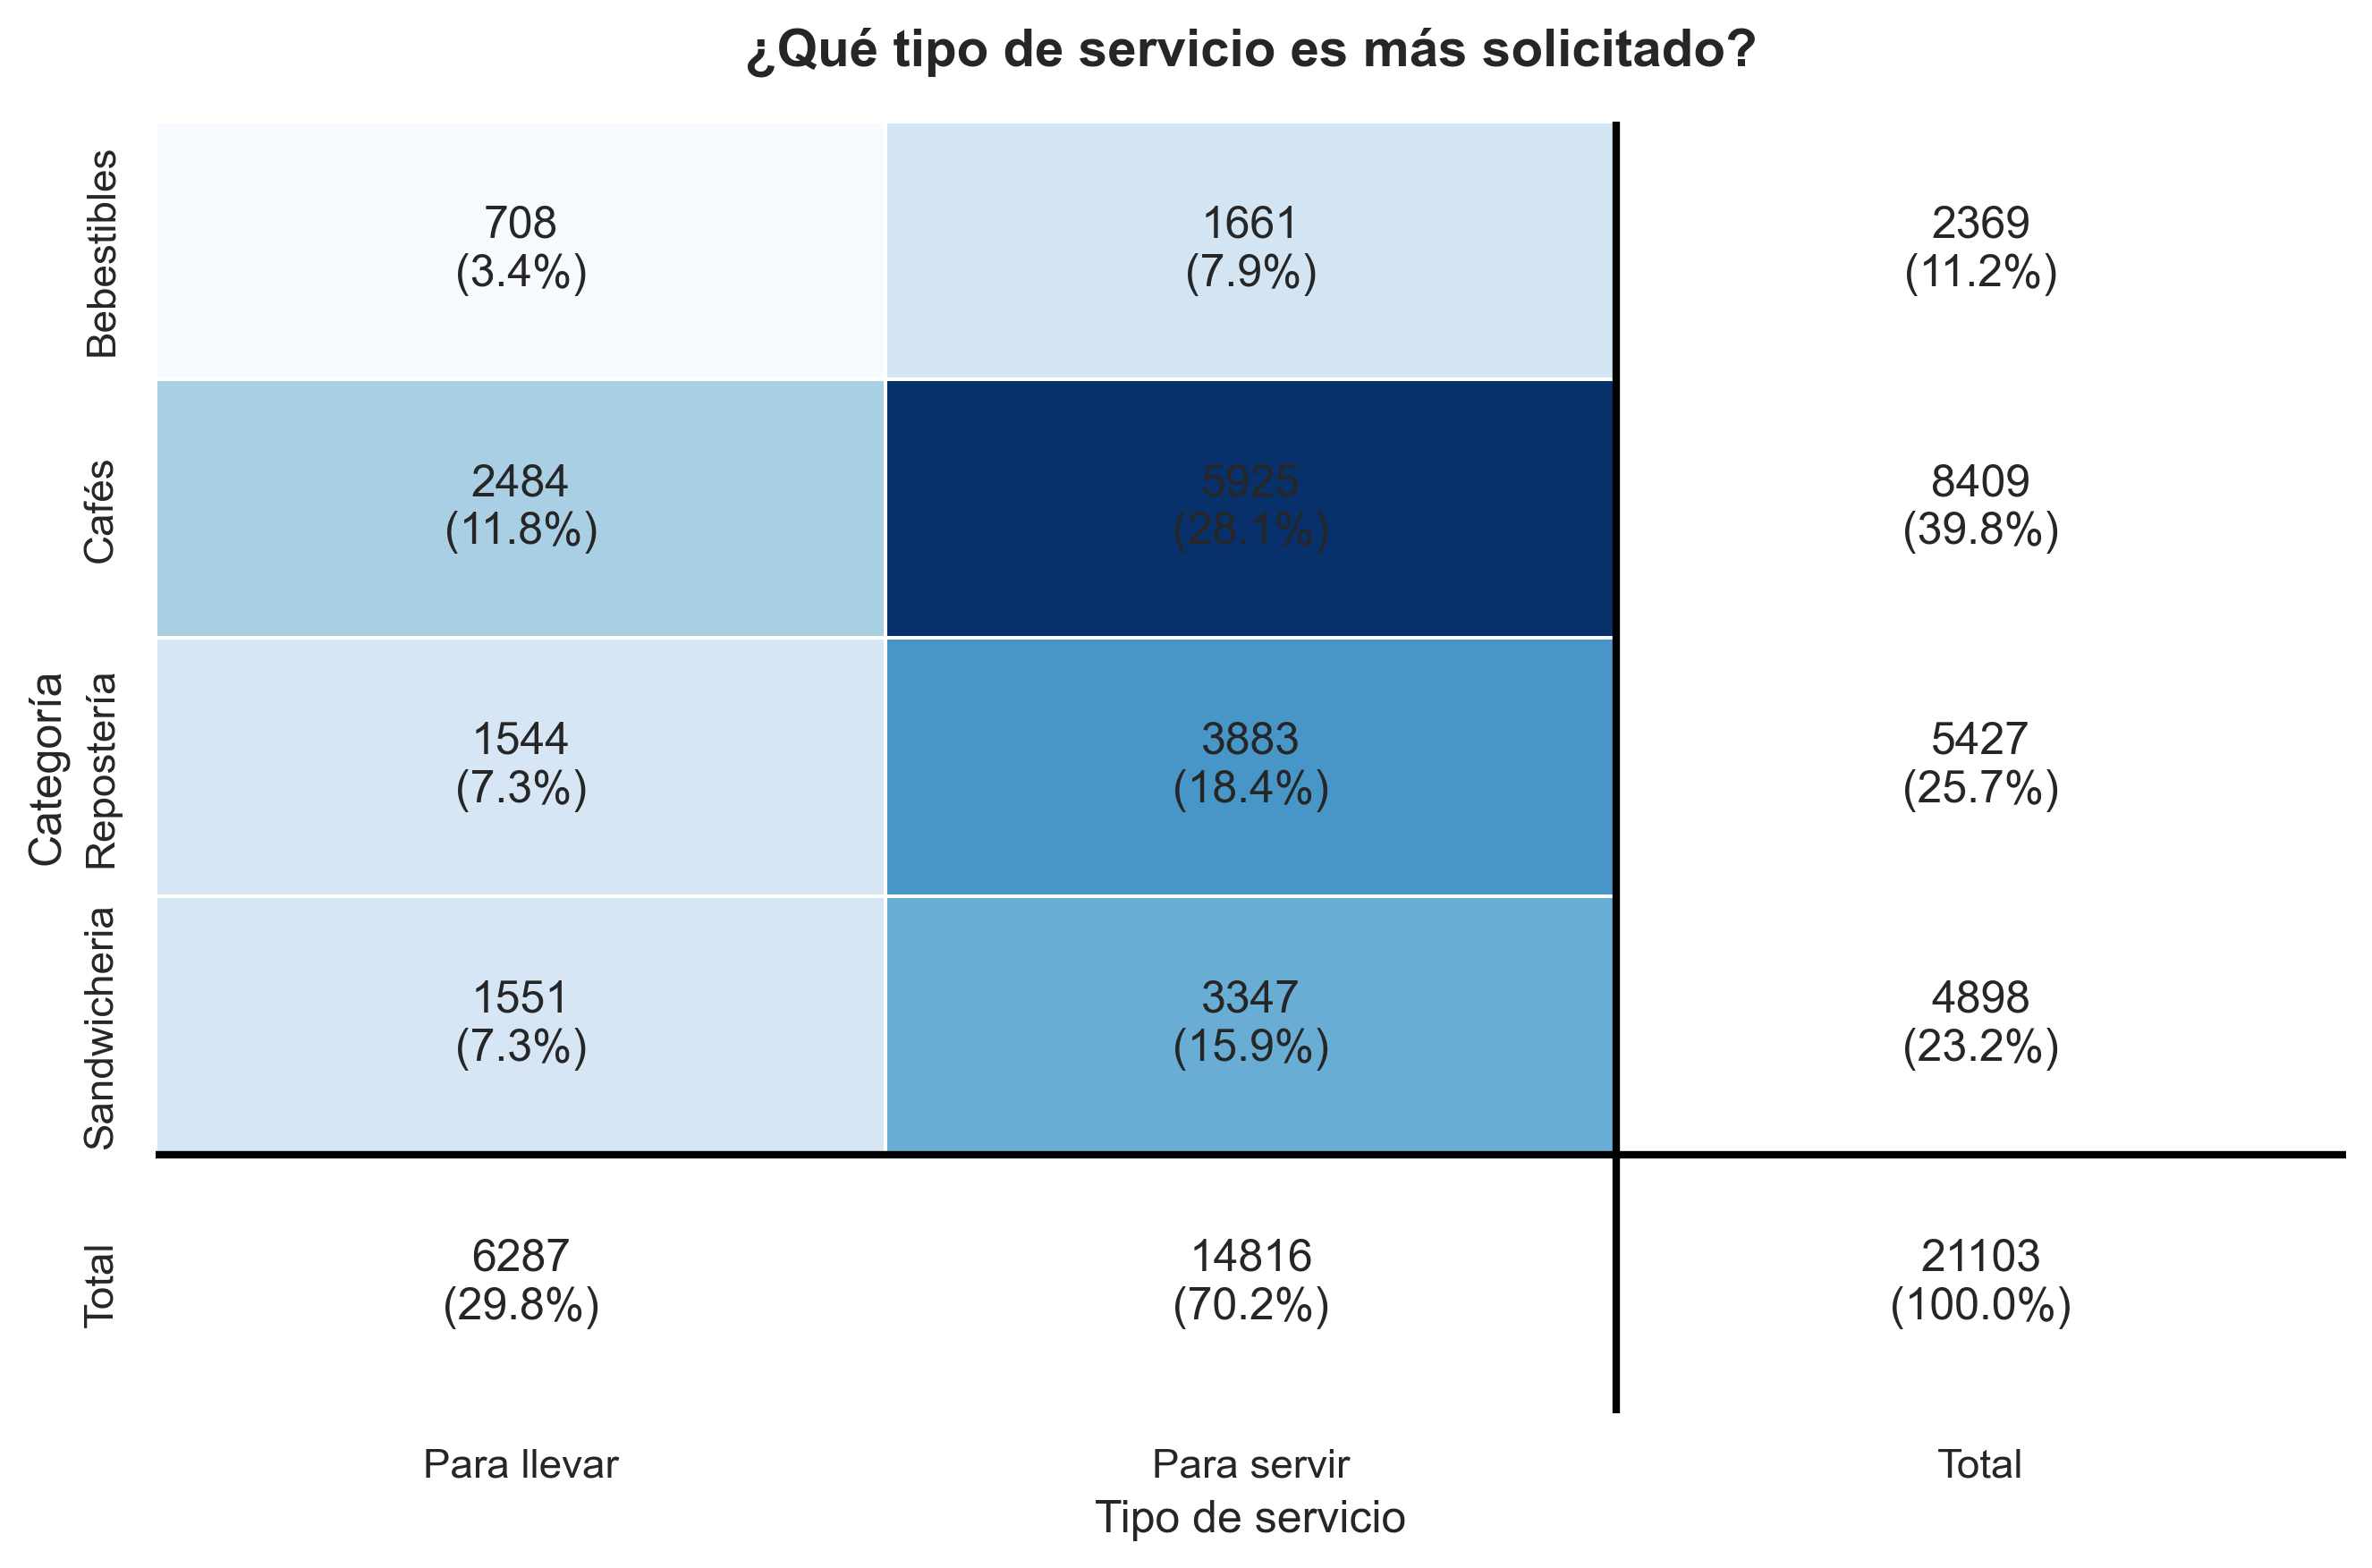
Service Channel
In-store vs. takeaway consumption preference.
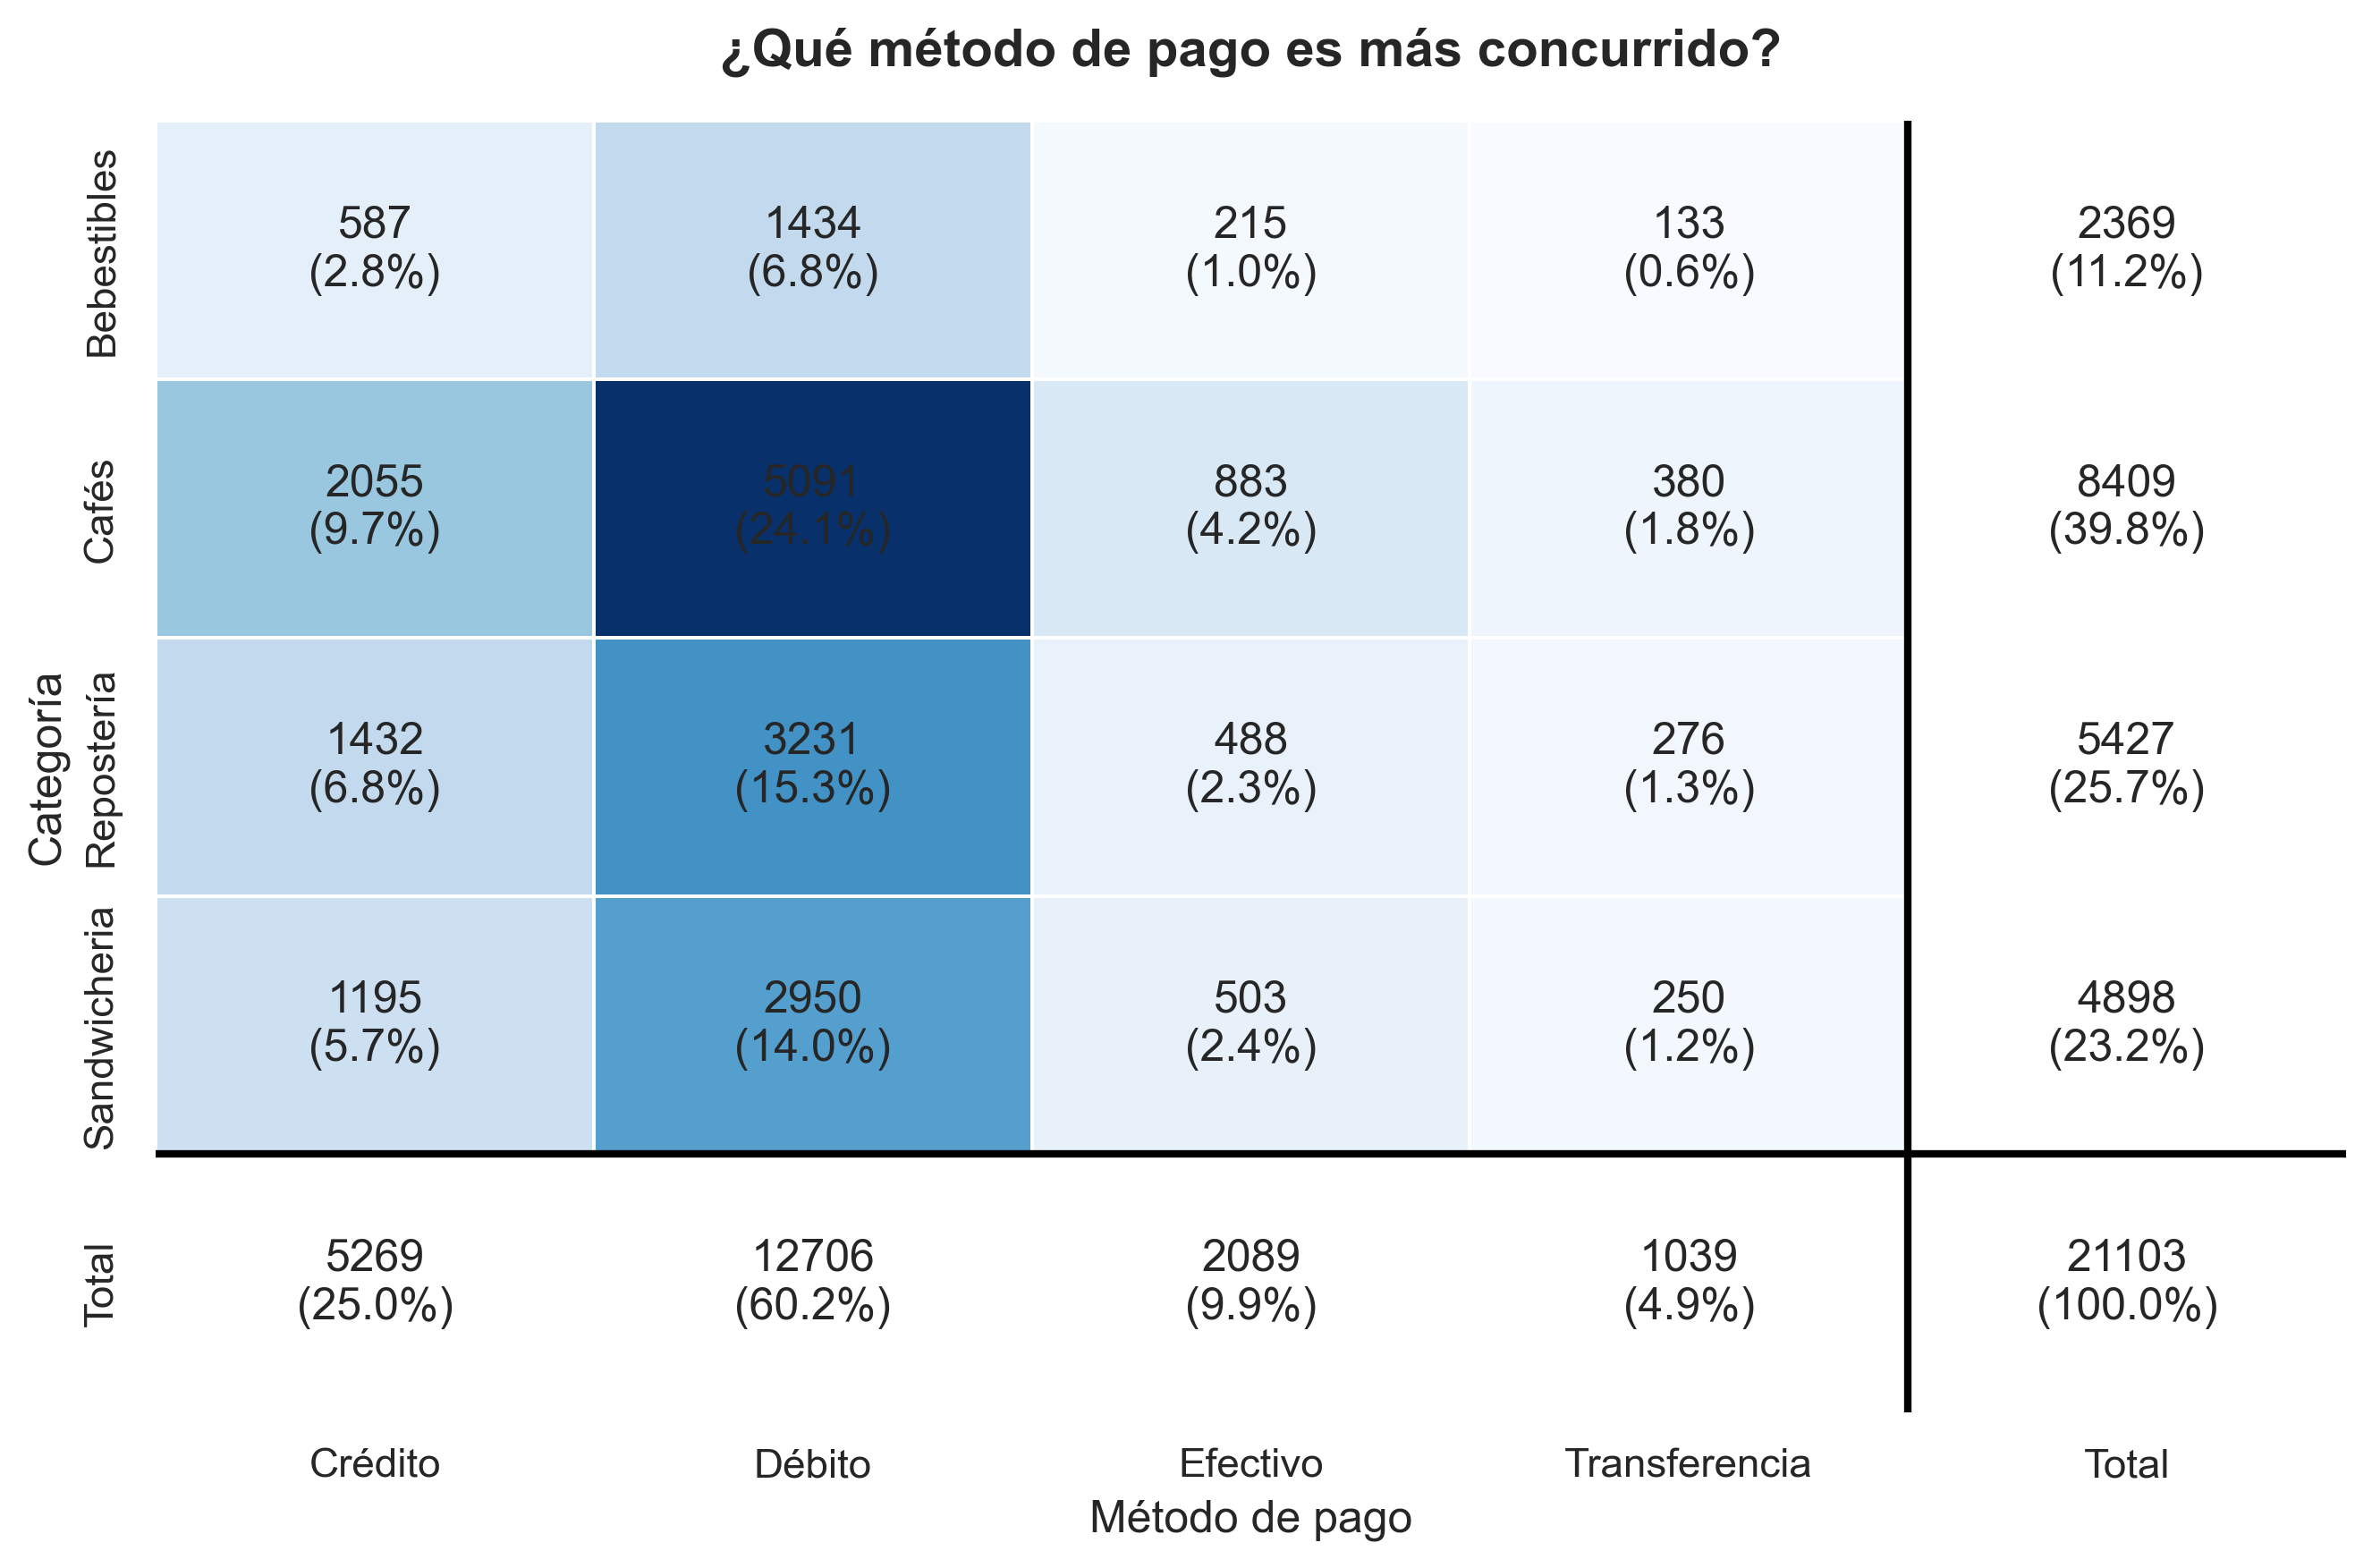
Payment Methods
Digital payment adoption exceeding 85%.
Executive Summary
Margin % vs. Dollar Profit Mismatch
79.8%Revenue (Coffee + Sandwiches)
• Teas (High Margin Illusion): High percentage margin (70%-77%), but return very low cash ($1,365 - $1,483 per unit, BCG Dog quadrant).
• Sandwiches (Profit Engine): Lowest percentage margin (62.4%), but yield the highest dollar profit per unit (e.g., Pulled Beef Croissant yields +$2,882 net profit/unit).
• Business Concentration: Coffee ($21.4M) and Sandwiches ($19.0M) drive nearly 80% of total revenue ($50.4M).
How Does the Chilean State Spend, and Where Are the Real Opportunities for New Suppliers?
Exploratory Data Analysis (EDA) & Mercado Público Dashboard in Python & Power BI
PythonpandasNumPyMatplotlibSeabornPower BI
Exploratory Data Analysis (EDA) of ~1.1 million public purchase orders from Mercado Público (ChileCompra) to identify spending patterns, geographic concentration, and accessible market niches for suppliers.
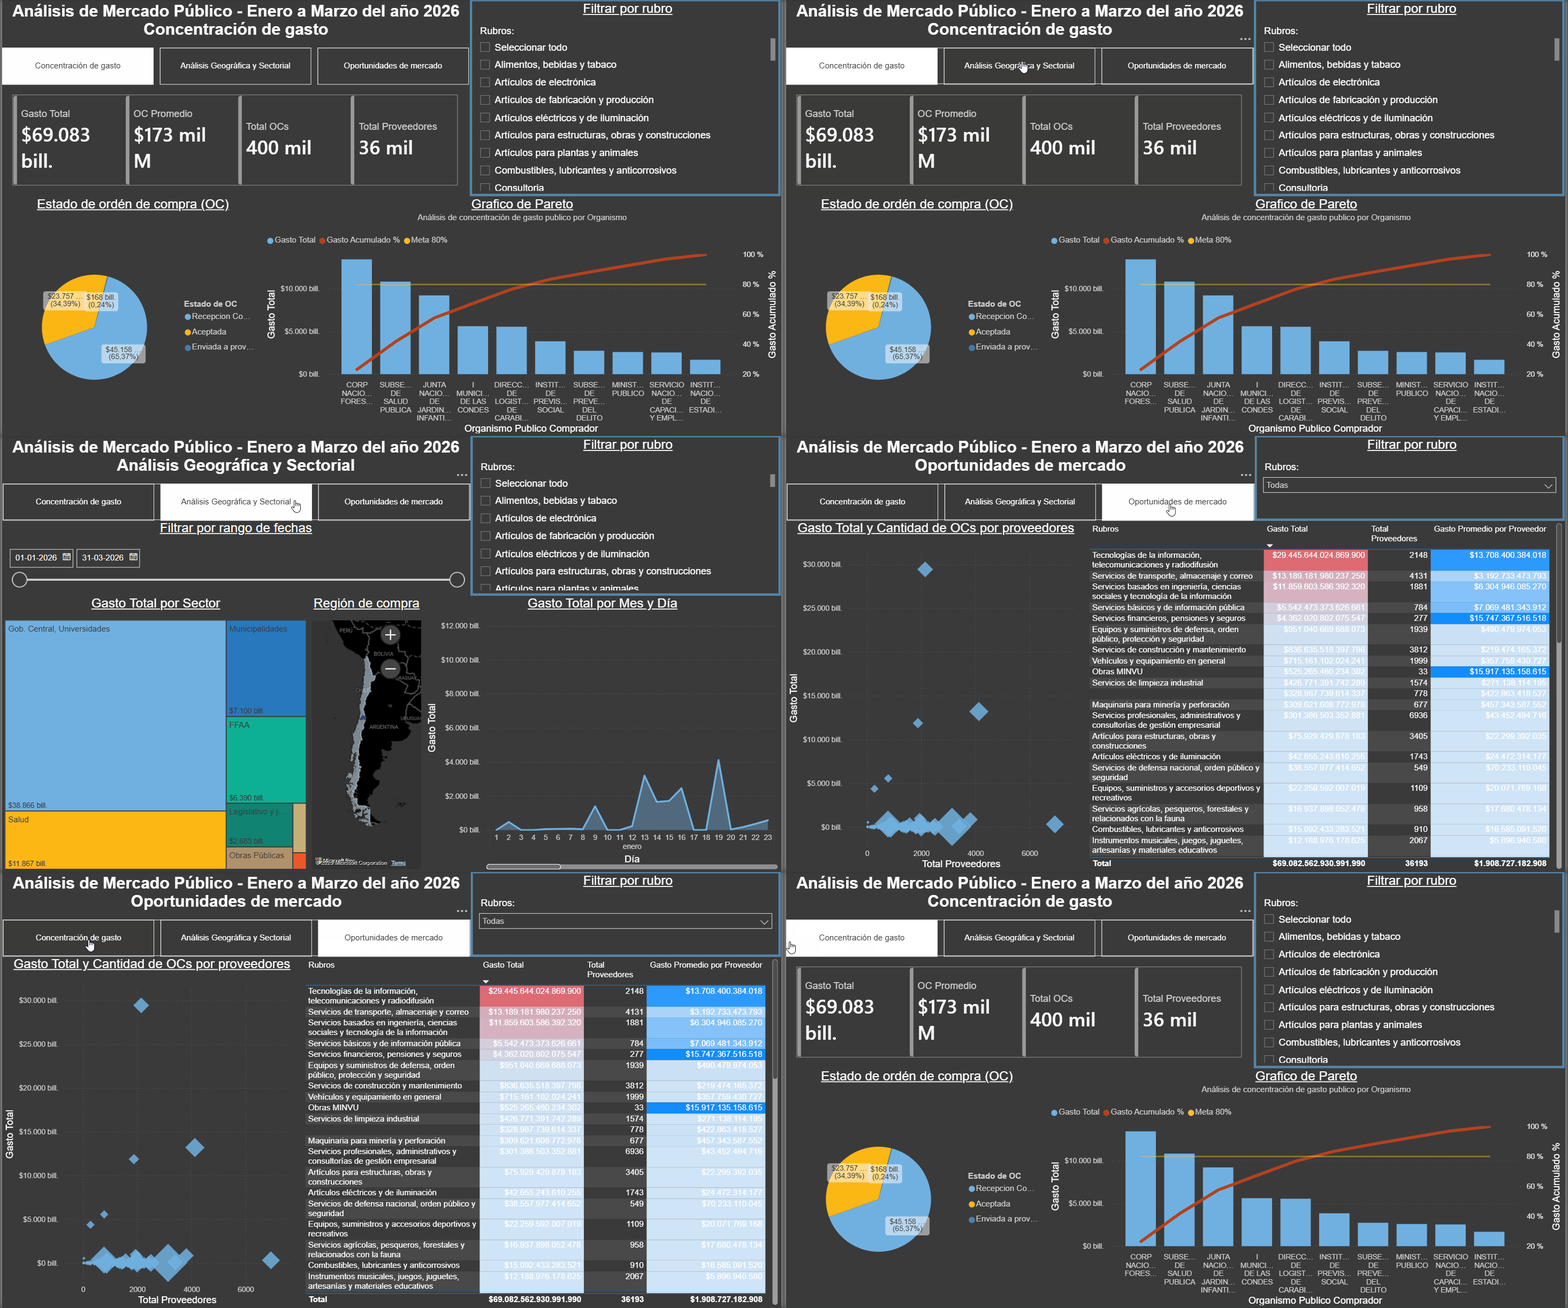
Final Interactive Dashboard (Power BI)
Interactive assessment of state resource allocation and regional/sectoral distribution.
Line vs. Order Granularity: Analyzed item line net totals (total_linea_neto) instead of total order amounts to prevent double counting
Currency & VAT Reconciliation: Verified 99.4% CLP transactions and reconciled gaps between net and gross order values.
Geographic Entity Normalization: Consolidated 32 inconsistent regional labels into the 16 official Chilean regions via Unicode normalization and keyword string matching.
Pedagogical Principle: Deep diagnosis of raw data anomalies prior to applying automated transformations.
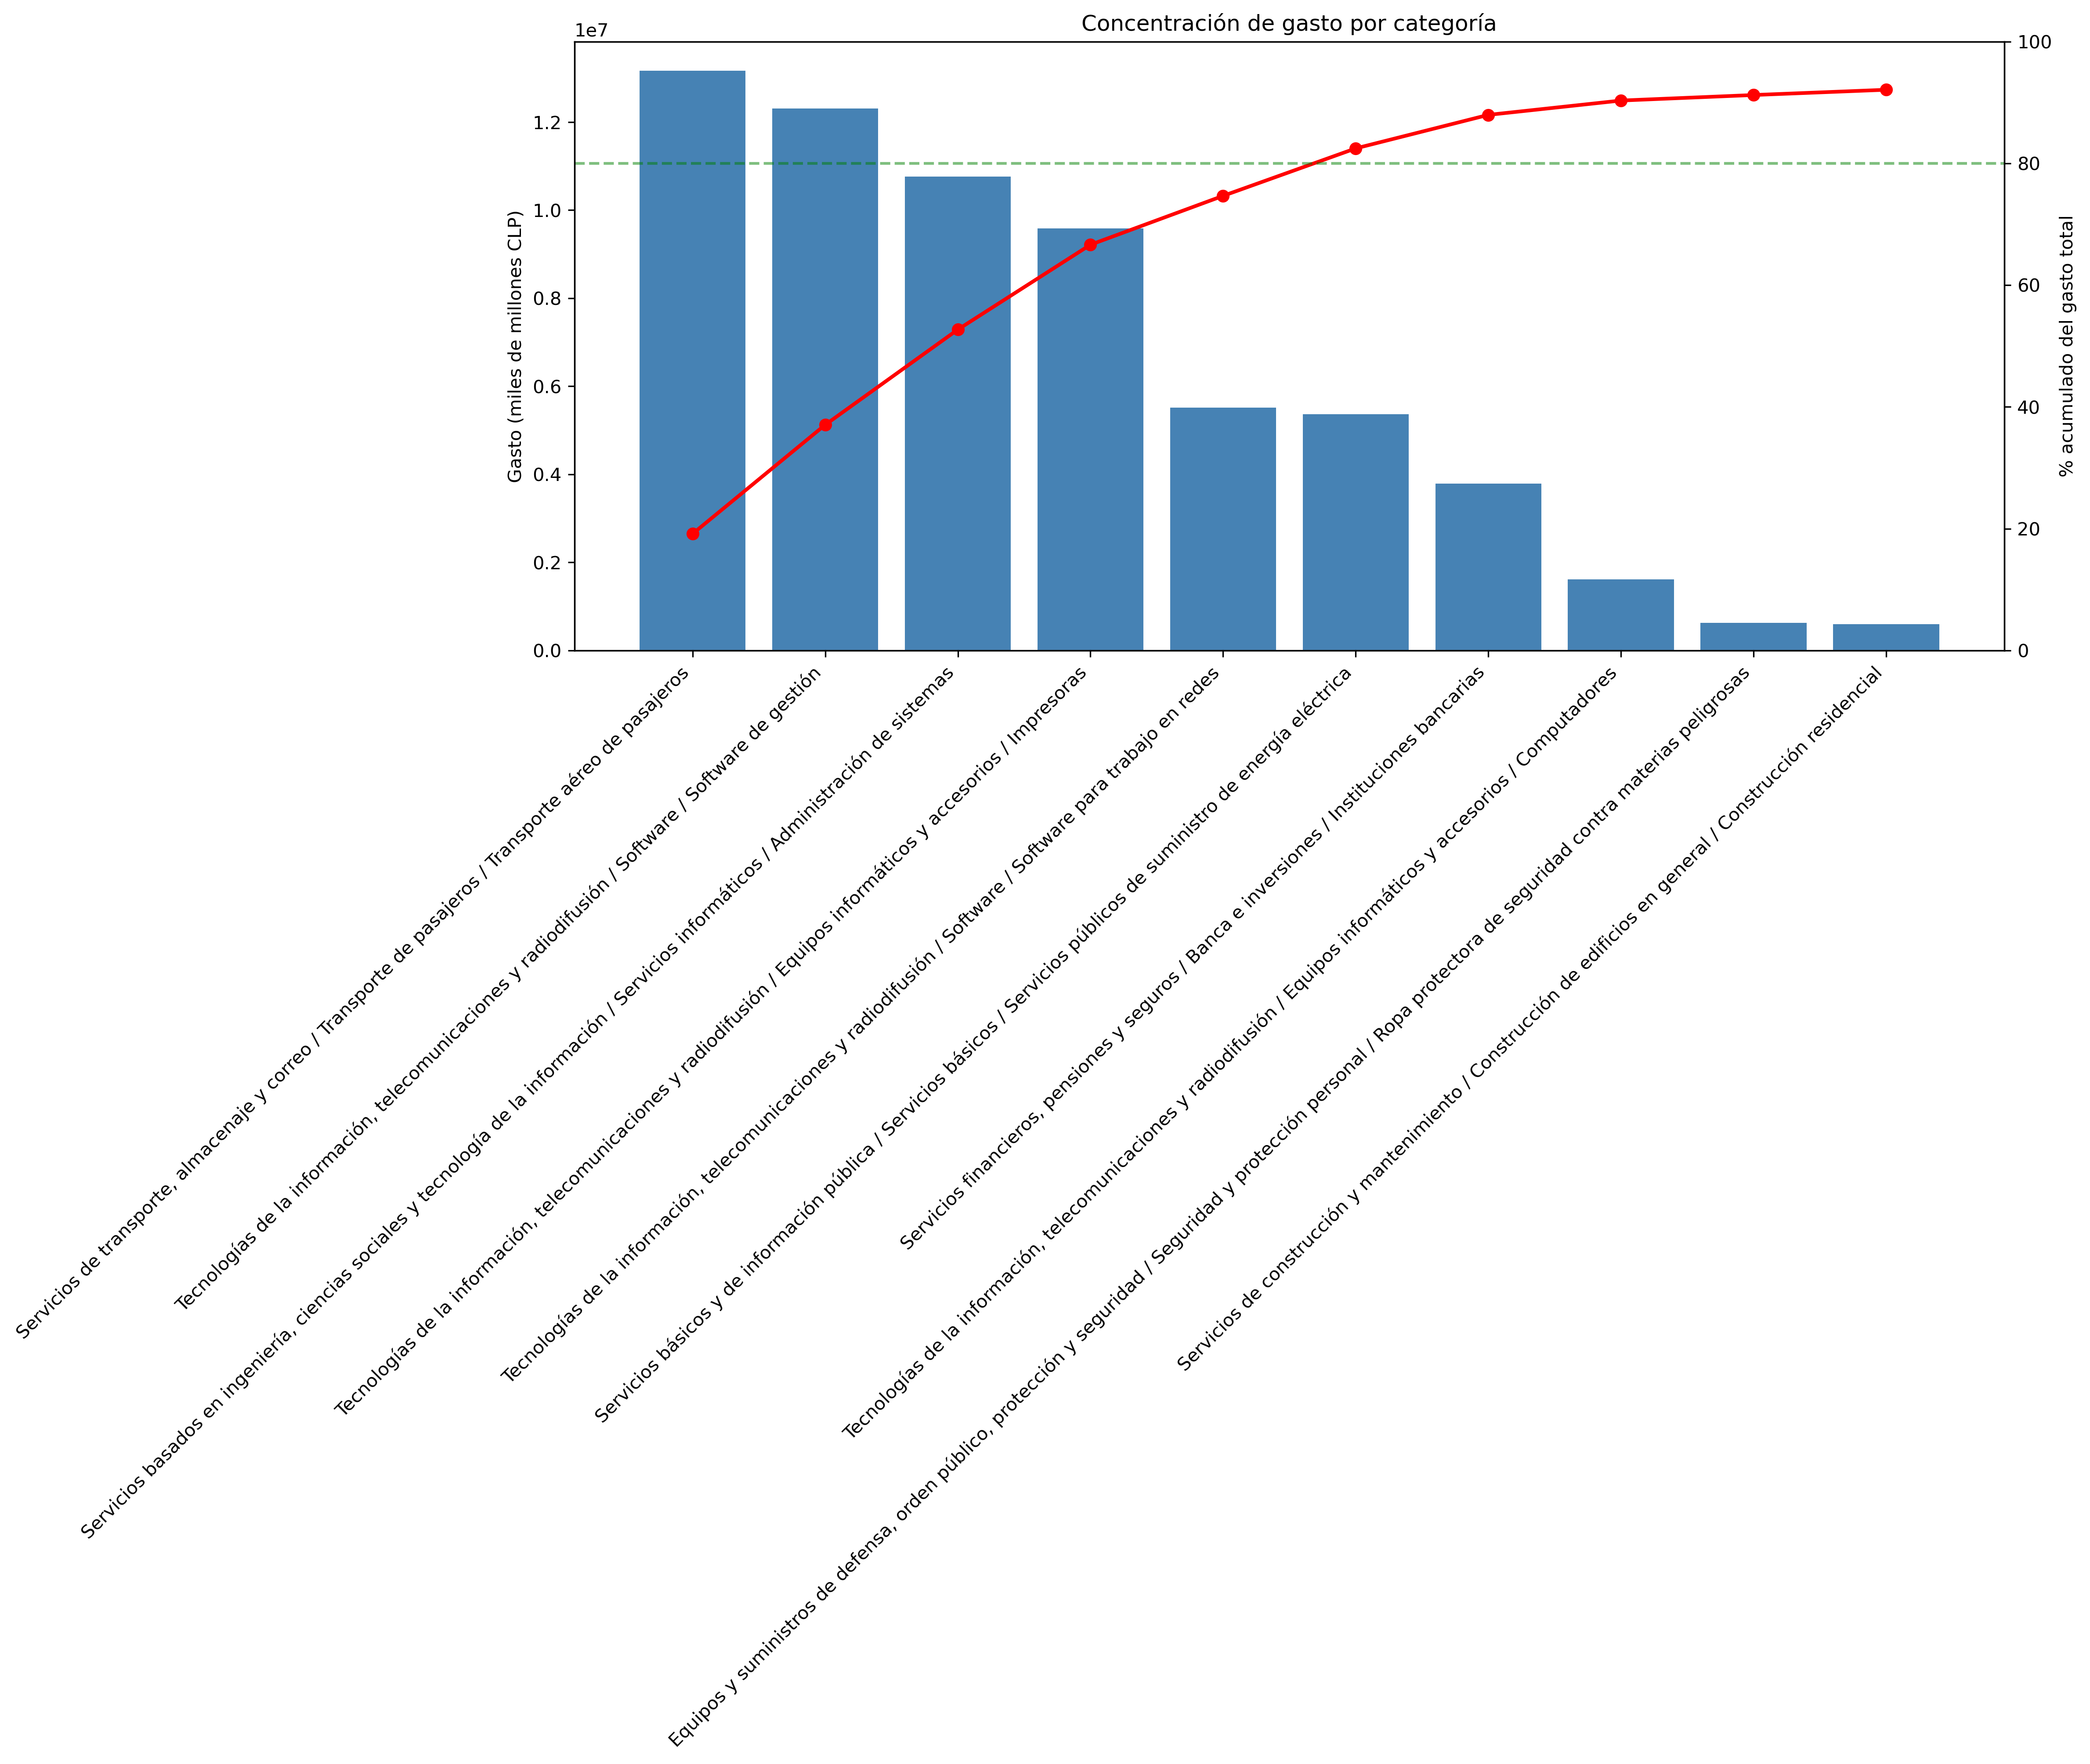
Chart-Backed Analysis & Pareto Breakdown
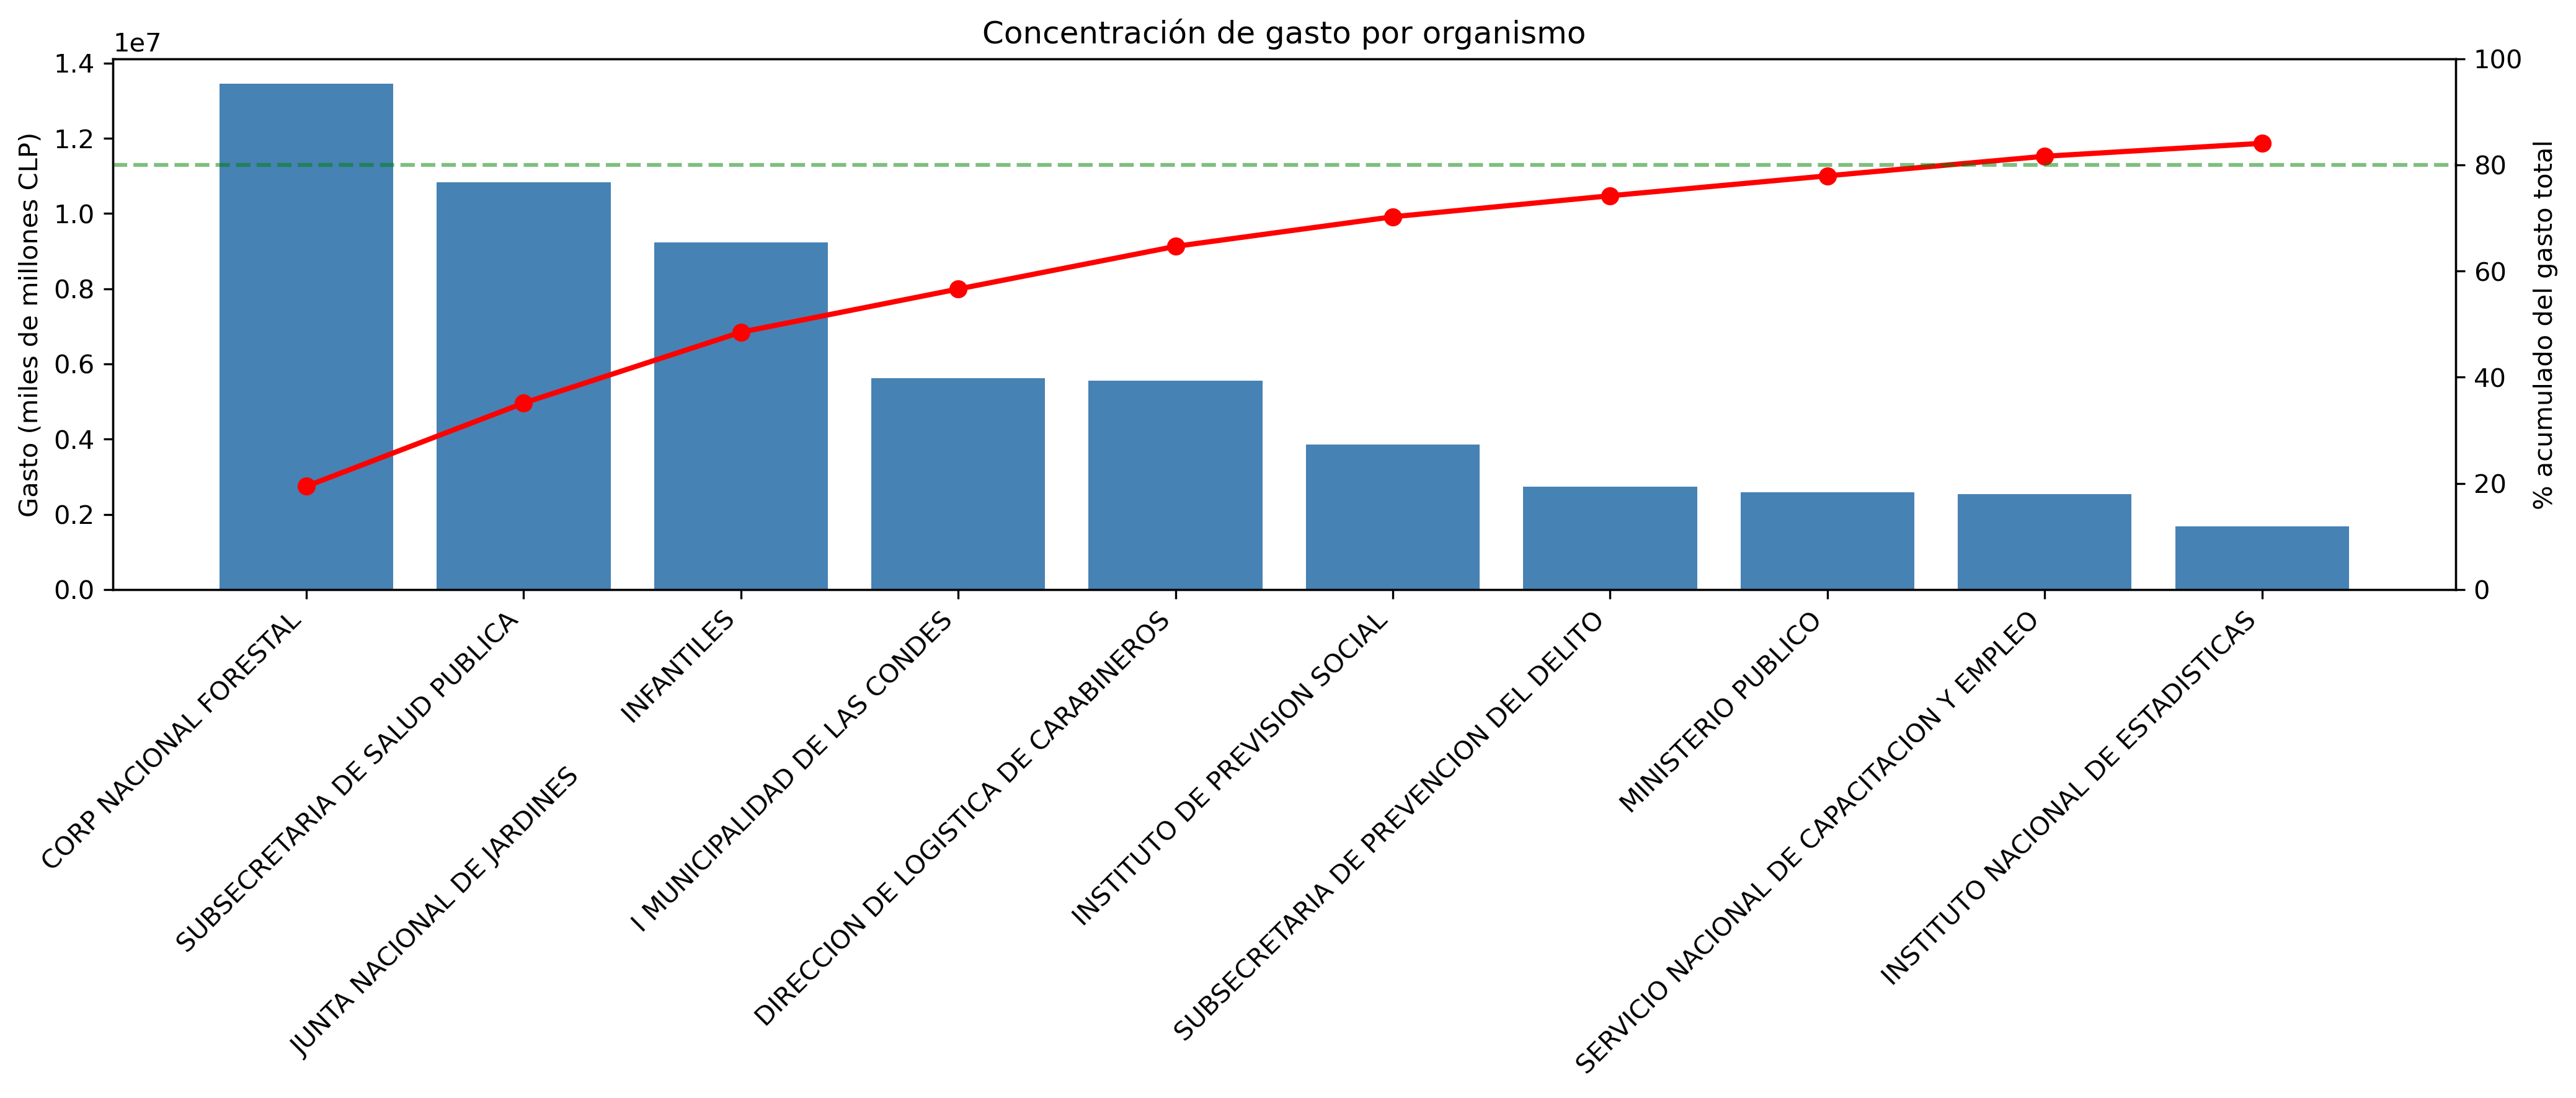
Pareto Chart by Agency
Top 10 entities absorb 84.1% of the total budget.
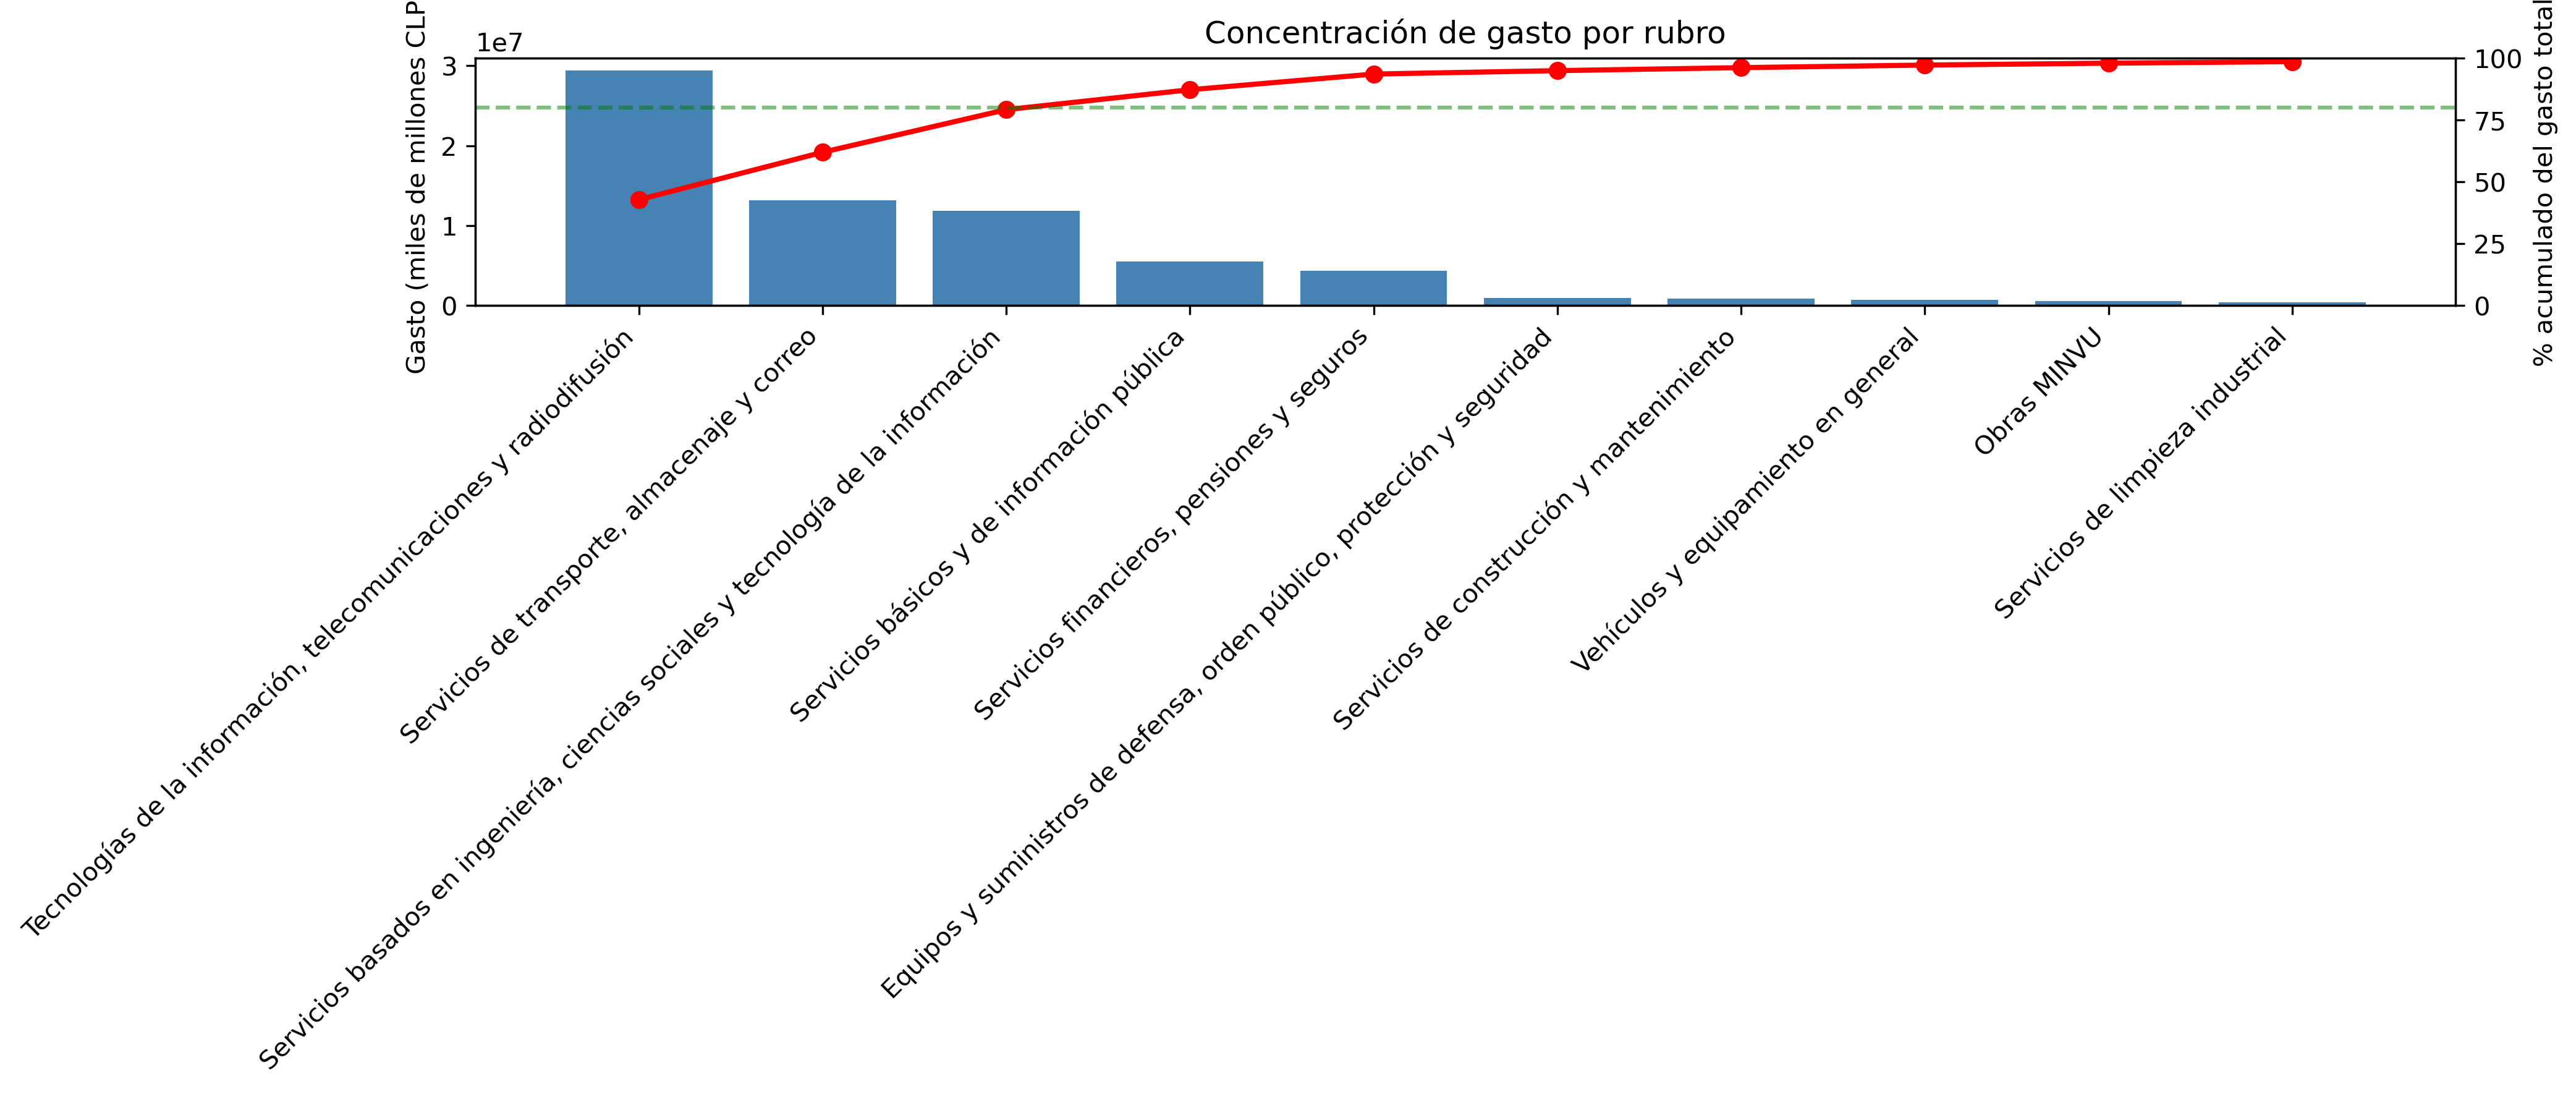
Sector Breakdown
IT & Telecom leading macro sector spending at 42.8%.
Category Breakdown
Granular distribution showing passenger transport & logistics dominance.
Market Opportunity Matrix
Distinguishing real open niches from captive markets based on supplier count and liquidity.
Category / Sector
Market Type
Suppliers
Spend / Supplier
Diagnosis
Transportation & Courier
Open / Dynamic
94
$140.09T CLP
🟢 Niche #1: High transaction flow.
IT & Telecom (Sub 1782)
Open / Dynamic
364
$26.33T CLP
🟢 Niche #2: Highest transactional turnover.
IT & Telecom (Sub 1802)
Moderate
429
$28.69T CLP
🟢 Niche #3: High accumulated liquidity.
Financial Services
Closed / Concentrated
6
$630.98T CLP
🔴 False Niche: Institutional banking oligopoly.
Mining Machinery
Closed / Concentrated
8
$37.12T CLP
🔴 False Niche: Extreme technical exclusivity.
Executive Summary
Public Procurement EDA
💡 InsightEDA Analysis
• Bidding Concentration: A significant portion of procurement transactions focuses on smaller public tenders, identifying key operational bottlenecks in award decisions.
• Optimization Opportunity: Strategic adjustments in procurement filtering reveal outlier bidding patterns and drive clearer decision-making for budget planning.
An end-to-end automated data pipeline that extracts CPI and UF series from the Central Bank of Chile (BCCh) REST API, cleans and transforms the data, loads it idempotently into PostgreSQL, and visualizes purchasing power loss and inflation protection in Power BI.
ETL Pipeline Execution Cycle
Automated continuous execution flow (click or hover to inspect a stage):
Loading pipeline...
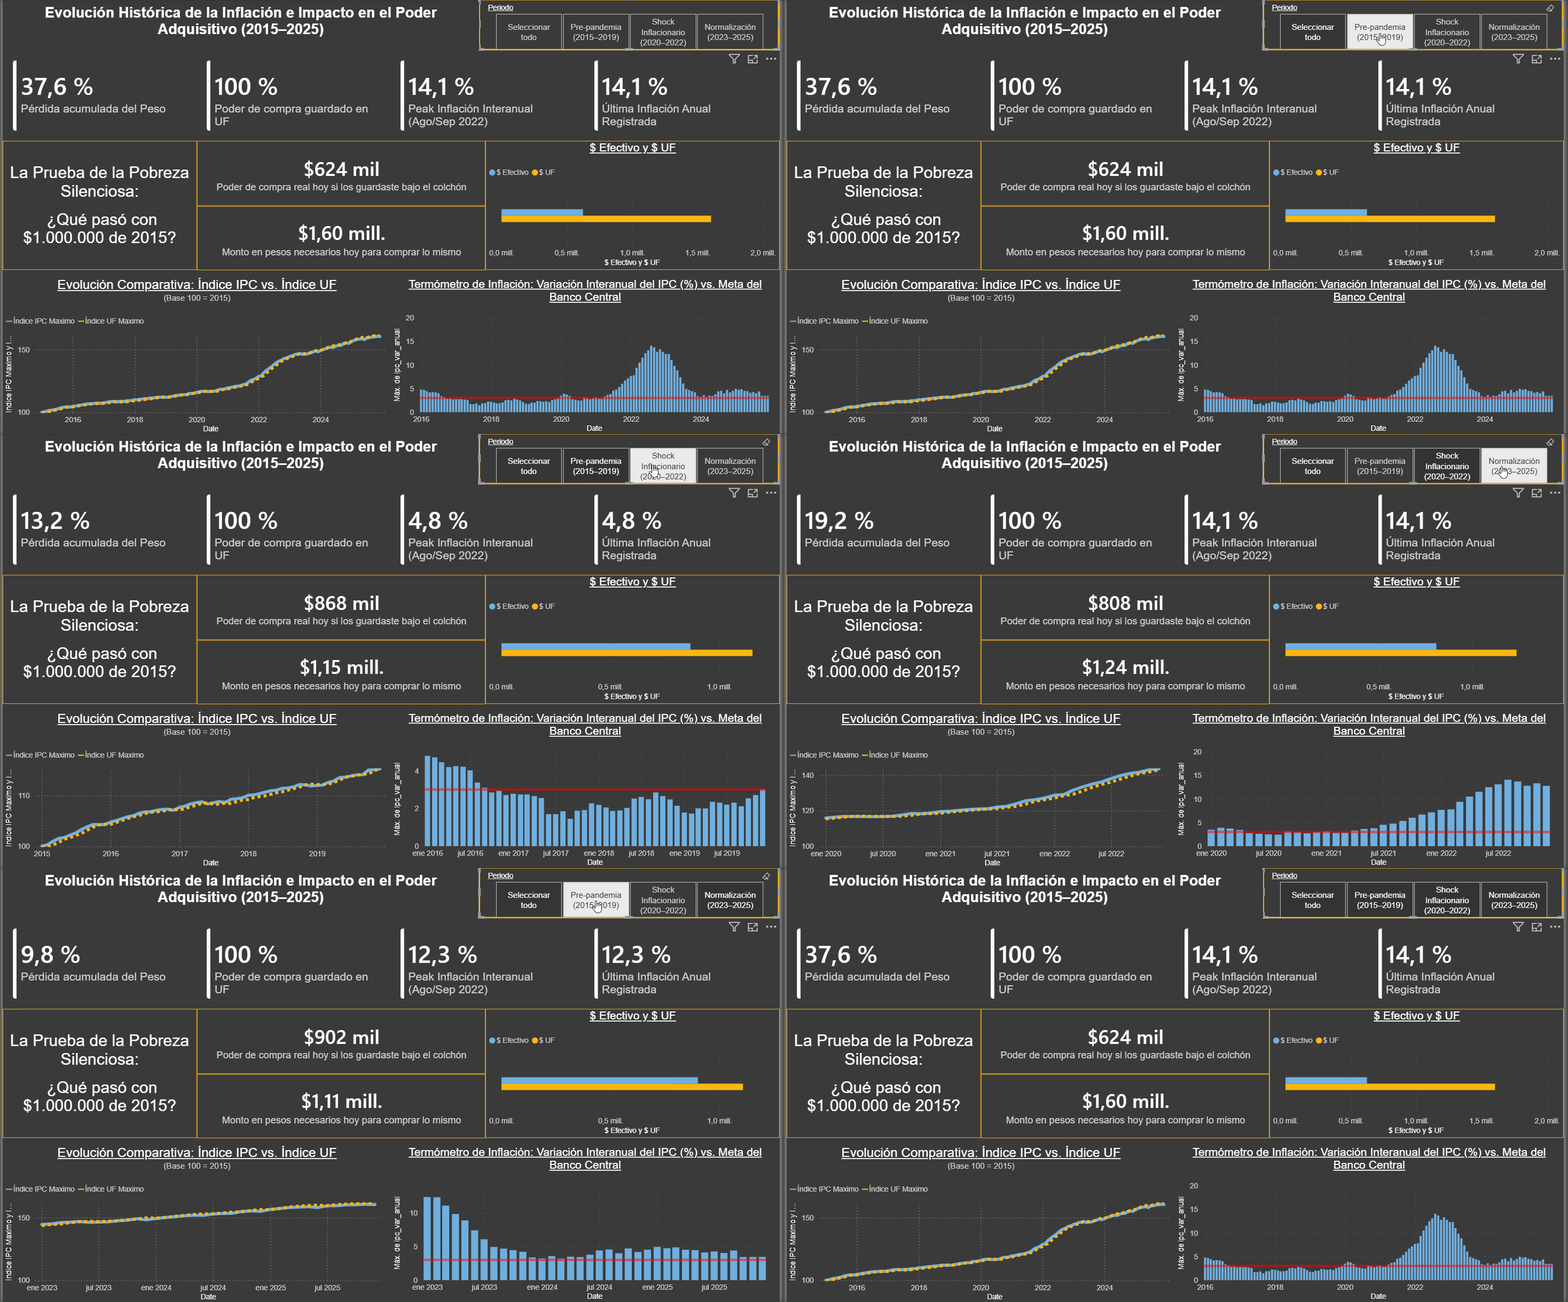
Final Interactive Dashboard (Power BI)
Visualizing 11 years of macroeconomic data (2015–2025): Chilean Peso purchasing power erosion vs. UF inflation hedging.
Direct HTTP requests for full response control over third-party SDK wrappers.
Transformation
Python (pandas)
Daily to monthly resampling, base-100 index alignment, and YoY inflation calculations.
Persistence
PostgreSQL + SQLAlchemy
Idempotent upsert loads (ON CONFLICT DO UPDATE) to eliminate duplicate rows on rerun.
Orchestration
Centralized main.py + Windows Scheduler
Automated monthly execution with exponential backoff retries and execution logging.
Key Engineering Decisions:
Idempotent Database Upsert: Re-running the pipeline will update existing records rather than creating duplicate entries.
Script-Anchored Absolute Paths: Uses Python pathlib to guarantee consistent execution whether triggered by CLI or Task Scheduler.
Layered Error Contextualization: Separate logging and retry mechanisms between extraction and orchestration.
Key Empirical Findings (2015 – 2025)
Quantitative evaluation of currency depreciation and real-value preservation mechanisms in Chile.
💡 Key Finding: Between 2015 and 2025, the Chilean Peso lost nearly 38% of its purchasing power (CPI grew from 100 to ~160). Concurrently, the UF index matched this growth (~162), empirically proving that UF perfectly shields capital against inflation over long horizons.